First login to client area.
Now navigate to VPS Management section and click on Monitoring icon.![]()
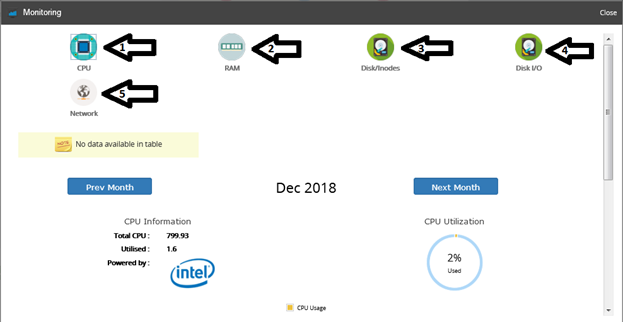
It will now prompt a dialog box which contain 5 options CPU, RAM. Disk/Inodes, Disk I/O and Network.
Click on the desired option as displayed above and scroll down to check its statistics.

